 |
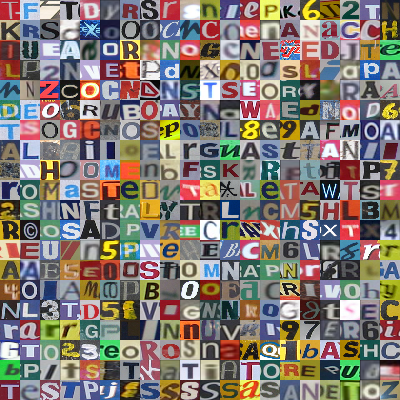
Figure 1. First 400 characters in Kaggle data base (First Steps With Julia | Kaggle) |
|
Posted: 11/15/21
Due: 11/22/21, 11:55PM
Science usually arises from observation of regularity in data. A first step in all scientific analysis is the organization of such observations into groups based upon some similarity criterion. Grouping through quantitative mathematical procedures requires the definition of a distance between observations and a procedure to form observation clusters. This project is an introduction to this basic task in data science using classification of letter images as an example.
|
Figure 1. First 400 characters in Kaggle data base (First Steps With Julia | Kaggle) |
Tasks:
Establish a distance function suitable for character identification
Establish number of clusters
Test clustering procedure for new character images
(Read First Steps With Julia | Kaggle and research -Means algorithm, e.g., Wikipedia)
The Kaggle database on character images contains 6220 files in .Bmp format, each of size 20 x 20 pixels. The ImageMagick package allows the images to be imported into Julia.
Once the Julia environment has been updated to contain the ImageMagick and Images packages, they can be used to analyze the character image data.
∴ |
using Images, ImageMagick |
∴ |
cd(homedir()*"/courses/MATH089/clustering/testResized") |
∴ |
files=readdir(); c=load(files[1]); nFiles=size(files); mx,my=size(c); [nFiles mx my] |
(1)
∴ |
c[1,1] |
RGB{N0f8}(0.475,0.424,0.514)
∴ |
Gray(c[1,1]) |
Gray{N0f8}(0.451)
∴ |
Float64(Gray(c[1,1])) |
∴ |
C=Float64.(Gray.(c)); imshow(C,cmap="gray"); |
Clustering is a common data analysis procedure, and a Julia package is available.
∴ |
import Pkg; Pkg.add("Clustering") |
Resolving package versions…
Installed NearestNeighbors ─
v0.4.9
Installed Clustering
───────
v0.14.2
Updating
‘~/.julia/environments/v1.6/Project.toml‘
[aaaa29a8] + Clustering v0.14.2
Updating
‘~/.julia/environments/v1.6/Manifest.toml‘
[aaaa29a8] + Clustering v0.14.2
[b8a86587] + NearestNeighbors v0.4.9
Precompiling project…
[32m ✓
[39m[90mNearestNeighbors[39m
[32m ✓ [39mClustering
2 dependencies successfully precompiled in 3
seconds (288 already precompiled)
∴ |
The -means algorithm seeks to group observations, each of dimension into clusters. For this application an observation is one of the character images and using all color channels.
∴ |
using Clustering |
∴ |
Each pixel in the image contains three color channels
∴ |
c[1,1] |
RGB{N0f8}(0.714,0.153,0.188)
∴ |
red(c[1,1]) |
∴ |
Float64(red(c[1,1])) |
Define a function to form a single vector of size from an image of size
∴ |
function FormObs(c) mx,my = size(c); d = 3*mx*my; r=Float64.(red.(c)); g=Float64.(green.(c)); b=Float64.(blue.(c)); reshape([r g b],(d,1)) end |
FormObs
∴ |
x=FormObs(c); |
∴ |
size(x) |
(2)
∴ |
size(c) |
(3)
The data set contains vectors for , where is the number of images, and each contains numbers. The goal of the -means algorithm is to define sets for that contain similar images, presumably of the same letter. Let . The -means algorithm minimizes the variance in each cluster
∴ |
function FormDataSet(n0,n,f)
  c = load.(f[n0:n0+n-1])
  X = FormObs(c[1])
  for i=2:n
    X = [X FormObs(c[i])]
  end
  return(X)
end |
FormDataSet
∴ |
n0=200; n=100; X=FormDataSet(n0,n,files); size(X) |
(4)
∴ |
kGroups=2; K=kmeans(X,kGroups); |
∴ |
S=assignments(K); nS=counts(K); C=K.centers; |
∴ |
S[1:10]' |
(5)
∴ |
size(C) |
(6)
∴ |
Each center represents an image. Display it.
(Present your conclusions on the use of random numbers to simulate real-life models)