1.MATH347 Homework 0
| Topic: |
TeXmacs and Julia basics |
| Post date: |
May 15, 2025 |
| Due date: |
May 16, 2025, 11:59PM on Canvas |
1.1.Background
This homework is meant to familiarize yourself with basic operations
within TeXmacs, a public-domain scientific editing
platform. The TeXmacs website provides several tutorials.
The key features of TeXmacs that motivate adoption of the platform for
this course are:
-
Simple, efficient editing of mathematical content. The editor has a
default text mode, and also a mathematics mode triggered by
inserting an equation from the menu using
Insert->Mathematics->(formula type), or the keyboard through
key-strokes $, or Alt-Shift-$. Here is an example: the solution of
the linear system
with a symmetric matrix, ,
can be found by gradient descent
-
Sessions from other mathematical packages can be inserted directly
into a document. Julia is used extensively in this course, and the
menu item Insert->Session->Julia leads to creation of space
within the document to execute Julia instructions. Define a matrix
.
∴ |
A=[1 2 3; -1 0 1; 2 1 -2] |
|
(1) |
Extend the Julia environment by adding a package to compute row
echelon forms. This need be done only once.
∴ |
import Pkg; Pkg.add("RowEchelon"); |
Resolving package versions…
No Changes to
‘~/.julia/environments/v1.9/Project.toml‘
No Changes to
‘~/.julia/environments/v1.9/Manifest.toml‘
Load the RowEchelon package into the current session and invoke
the rref function.
|
(2) |
Compute the inverse of the matrix .
|
(3) |
-
Documents can readily be converted to other formats: PDF, LaTeX,
HTML. All course documents, including the website are produced with
TeXmacs.
1.2.Theoretical questions
1.2.1.Text editing in TeXmacs
-
Problem
-
Write an itemized list of ingredients in your favorite dessert
recipe. (Menu->Insert->Itemize)
-
Answer
-
1.2.2.Inline mathematics
-
Problem
-
The fundamental theorem of calculus states for
. Apply
this result for ,
,
,
.
Write your answer inline.
-
Answer
-
1.2.3.Displayed mathematics
-
Problem
-
A matrix is a row of column vectors, ,
which can be expressed in terms of vector components as
Look up the definition of a Hilbert matrix
and write in the above forms, both as a row of column vectors, and
as components.
-
Answer
-
1.2.4.Julia session - working with
numbers
-
Problem
-
Insert a Julia session and produce a table of the squares and
cubes of the first ten natural numbers.
-
Answer
-
1.2.5.Julia session - working with column
vectors
-
Problem
-
Insert a Julia session and define the vectors
-
Answer
-
1.2.6.Julia session - working with row
vectors
-
Problem
-
Insert a Julia session and define the vectors
-
Answer
-
1.2.7.Julia session - assembling column
vectors into a matrix
-
Problem
-
Insert a Julia session and define the matrix
-
Answer
-
1.2.8.Julia session - assembling row vectors
into a matrix
-
Problem
-
Insert a Julia session and define the matrix
-
Answer
-
1.2.9.Julia session - componentwise definition
of a matrix
-
Problem
-
Insert a Julia session and display the Hilbert matrix .
-
Answer
-
1.2.10.Julia session - constructing plots
-
Problem
-
Insert a Julia session to plot the function .
-
Answer
-
1.3.Data Science Application
Carry out linear regression, i.e., fitting a line to data.
1.3.1.Generate synthetic data
-
Problem
-
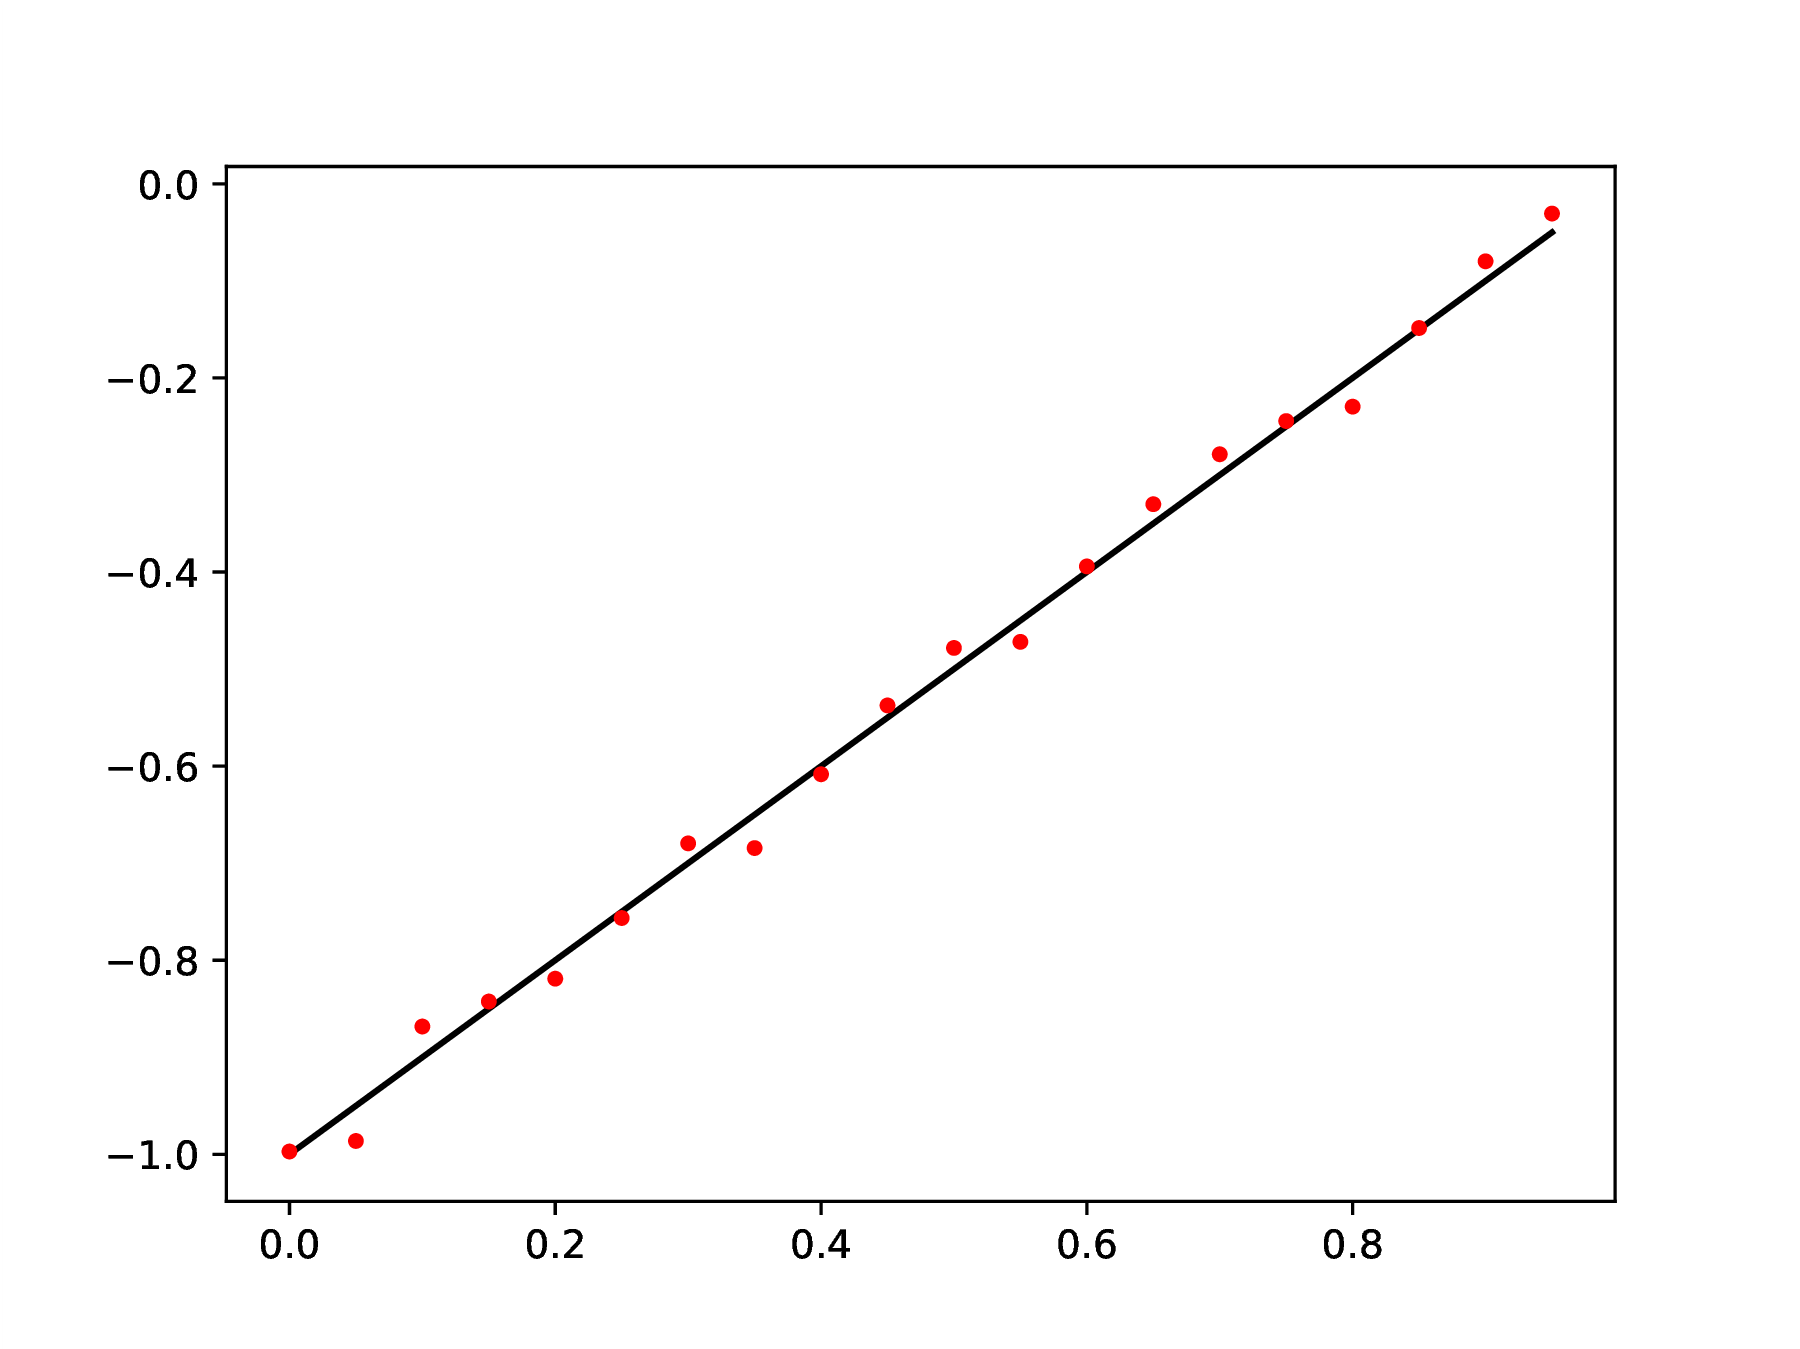
The following generates data by random perturbation of points on a
line .
∴ |
m=20; x=(0:m-1)/m; c0=-1; c1=1; yex=c0 .+ c1*x; |
∴ |
y=yex .+ 0.1*(rand(m,1) .- 0.5); |
∴ |
clf(); plot(x,yex,"k",x,y,"r."); |
∴ |
cd(homedir()*"/courses/MATH347DS/homework/hw00"); |
∴ |
savefig("H00Fig01.eps"); |
Repeat for different values of .
 |
|
Figure 1. Perturbation of points on a
line.
|
-
Answer
-
1.3.2.Form the normal system
-
Problem
-
Define matrices , ,
and vector
-
Answer
-
1.3.3.Solve the least square problem
-
Problem
-
Solve the system
by use of the Octave backslash operator c=N\b.
Display the coefficient vector ,
and compare to the values you chose in Question 3.1. Also compute
,
using ytilde as a notation.
-
Answer
-
1.3.4.Plot the result
-
Problem
-
Plot the original line, perturbed points and linear regression of
the perturbed points.
-
Answer
-
Submission instructions. Save your work, and also
export to PDF (menu File->Export->Pdf). In Canvas submit the
files: