 |
| Topic: | Linear combinations, measuring vectors |
| Post date: | May 15, 2025 |
| Due date: | May 19, 2025 |
This homework is meant as a tutorial on matrix computations, in particular:
vector addition and scaling;
vector norms;
inner products;
matrix-vector products;
linear mapping matrices;
linear mapping composition matrix-matrix products.
Consider gray-scale images of size pixels, where the brightness value of pixel at position , , is , , .
Represent the images as column vectors of a matrix . What is the matrix size?
Construct a composite image obtained by taking fractions of image , , .
Verify whether for , defined by
is a norm in .
Verify whether for , defined by
is a norm in .
Verify whether for , defined by
is a scalar product in .
Verify whether for , defined by
is a scalar product in .
Verify that the “row-over-columns” matrix multiplication rule is equivalent to columns of matrix-vector multiplications, i.e., for , ,
Linear mapping representation
Determine the matrix of the linear mapping representing rotation of a vector by angle followed by reflection across the -axis. Let denote the matrices of the mappings corresponding to: (1) reflection by angle ; (2) reflection across the -axis. Verify that corresponds to . Does ?
Linear mapping composition
Construct the rotation matrices for rotation by angles . Verify , and the trigonometric identities for sine and cosine of sums of angles. Does ? Compare your answer to previous case.
Block matrix operations
Identify repeated blocks in the matrices and carry out the mutiplication in Julia: (1) componentwise; (2) by blocks. Compare the two results.
Block matrix operations
Carry out the following block matrix multiplication
Electroencephalograms (EEGs) are recordings of the electric potential on cranium skin. Research on brain activity uses EEGs to determine specific activity patterns in the brain. For example, epileptic seizures have a distinctive EEG signature. EEG data can be loaded from the course data directory. As is typically the case in data analysis, an additional package is required to read in the particular data format; in this case the data is given in Matlab .mat format. This need only be done once.
∴ |
import Pkg; Pkg.add("MAT"); |
Updating registry at
‘~/.julia/registries/General.toml‘
Resolving package versions…
No Changes to
‘~/.julia/environments/v1.10/Project.toml‘
No Changes to
‘~/.julia/environments/v1.10/Manifest.toml‘
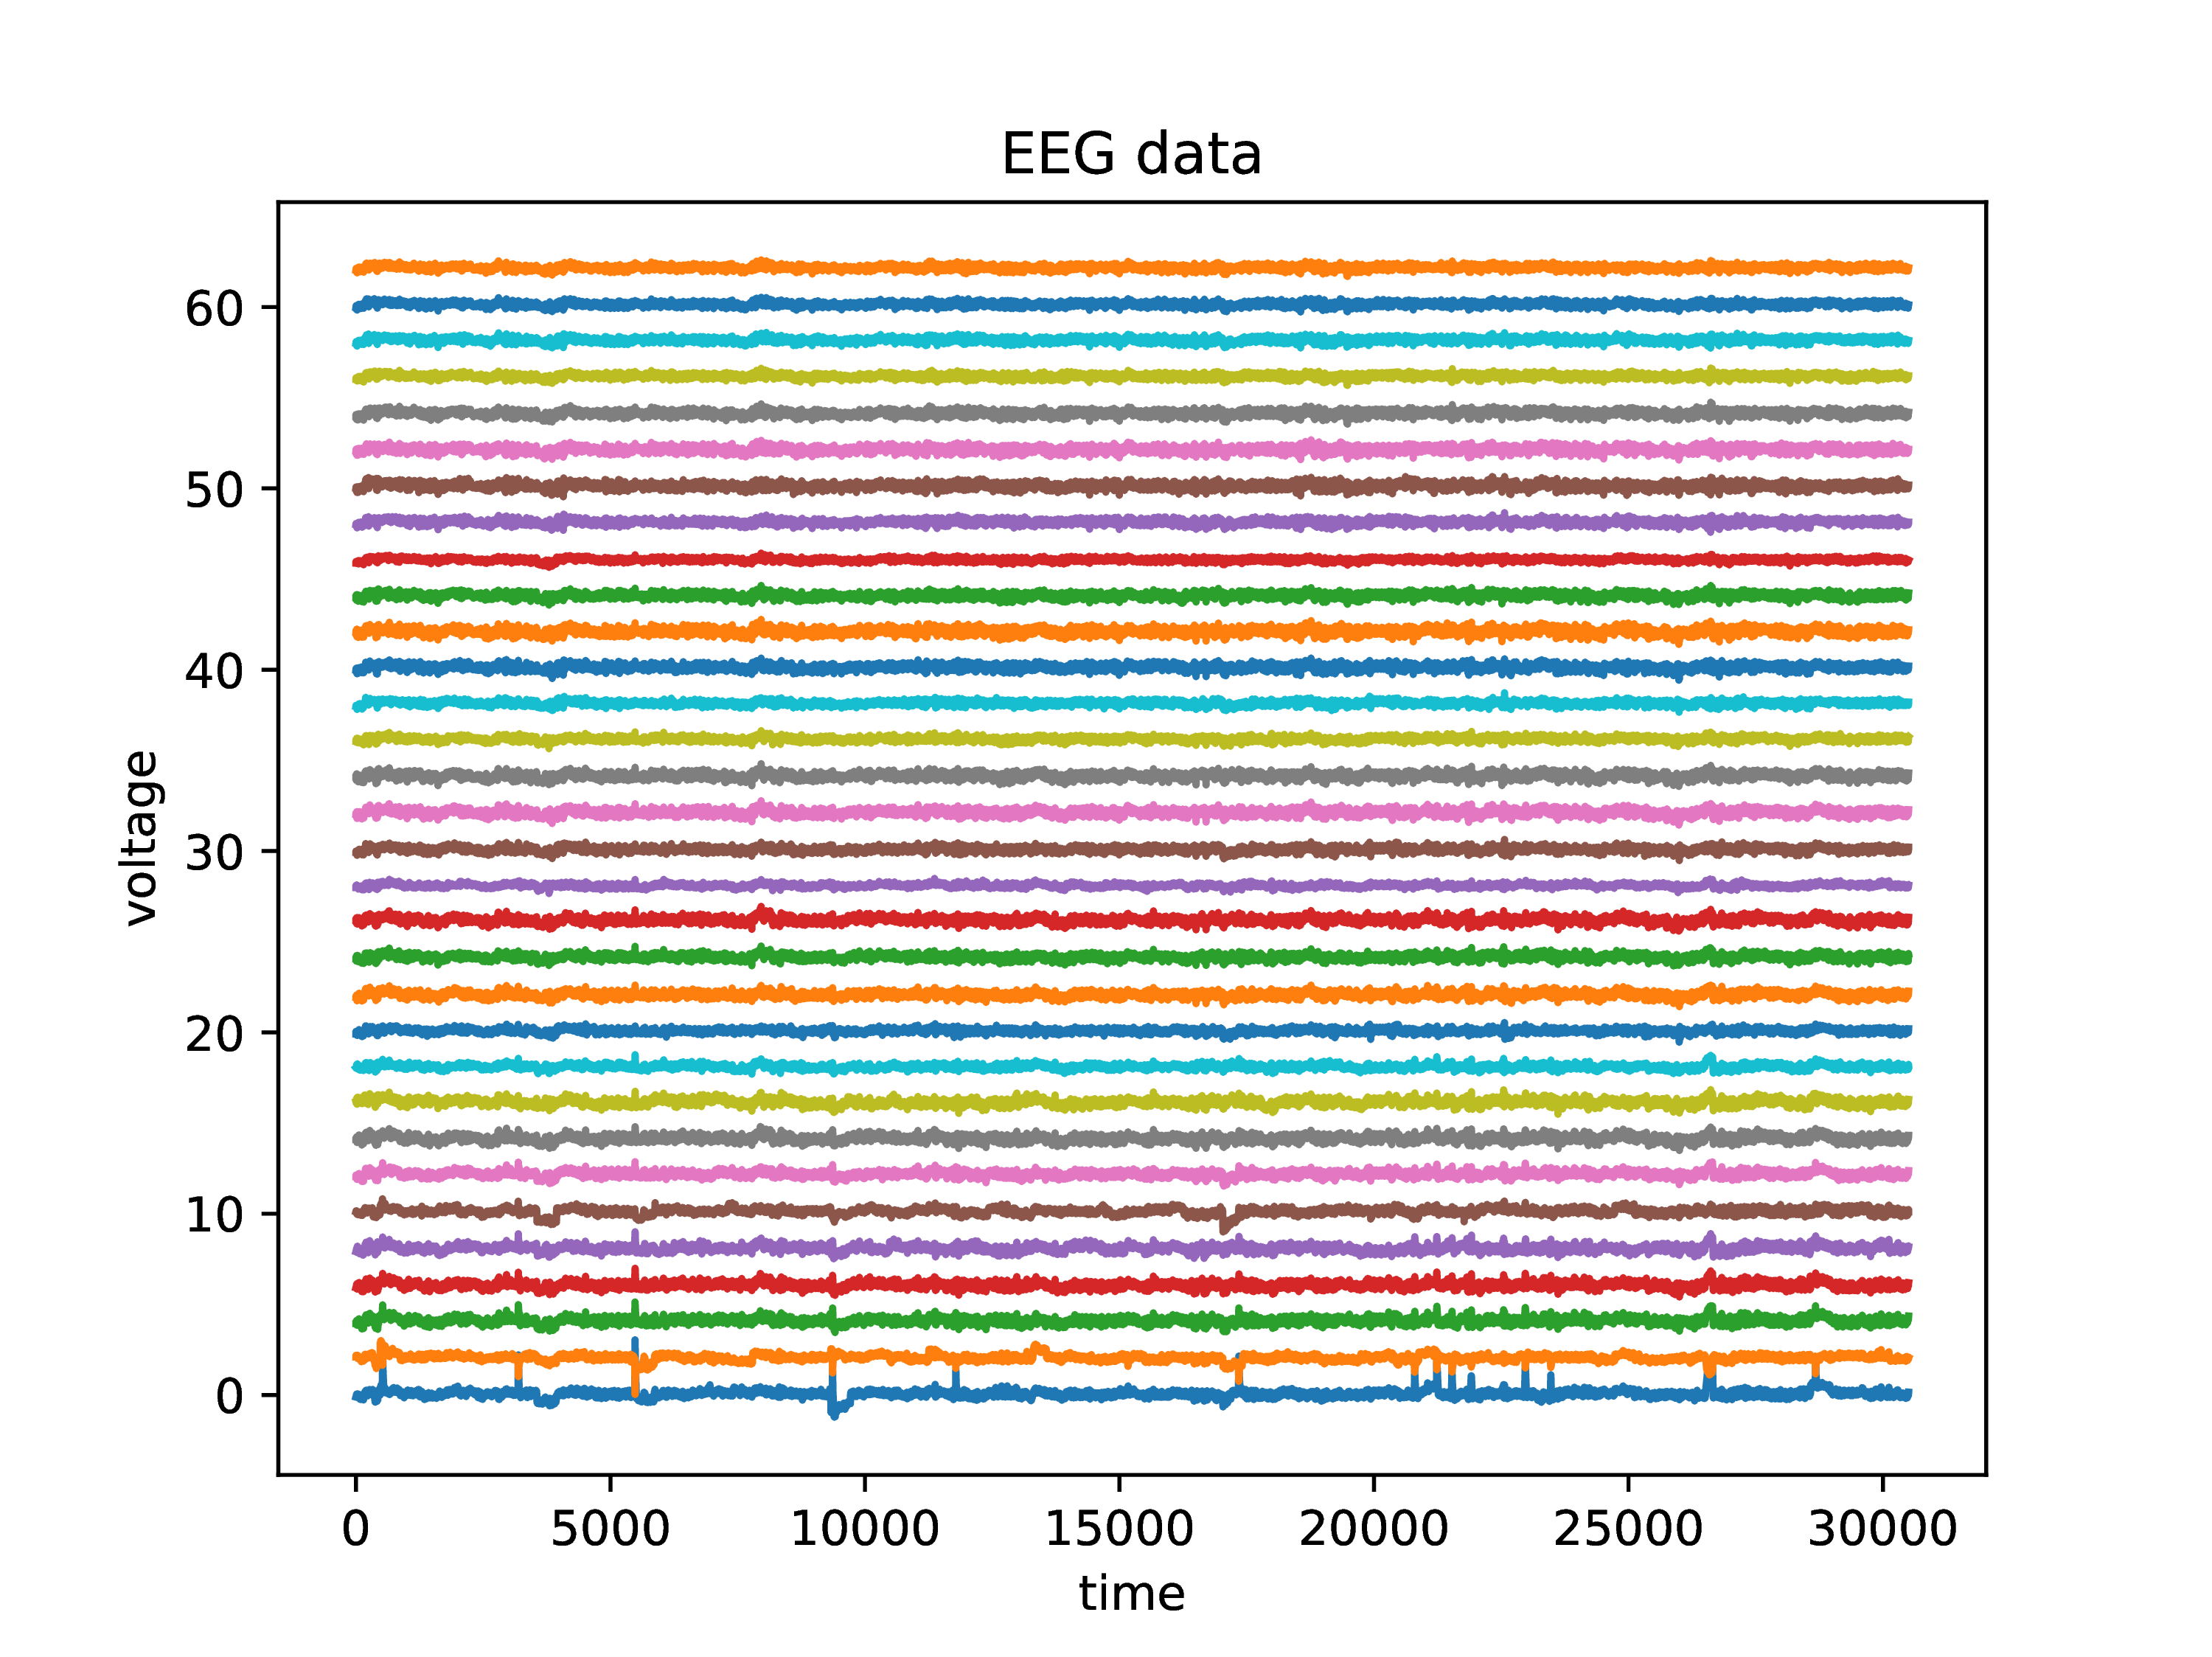
Load EEG data using the Julia package to read Matlab files. There are electrode recordings at moments of time. A common first step in working with data is centering and scaling values to a standard range.
∴ |
using MAT |
∴ |
DataFileName = homedir()*"/courses/MATH347DS/data/eeg/eeg.mat"; |
∴ |
DataFile = matopen(DataFileName,"r"); |
∴ |
dict = read(DataFile,"EEG"); |
∴ |
data = dict["data"]'; |
∴ |
m,n=size(data) |
(1)
∴ |
mx=findmax(data[:,4:28])[1]; mn=findmin(data[:,4:28])[1]; |
∴ |
d = 2*(data .- mn)/(mx-mn) .- 1; |
∴ |
clf(); |
∴ |
for j=1:n plot(d[:,j].+(j-1)*2) end |
∴ |
xlabel("time"); ylabel("voltage"); title("EEG data"); |
∴ |
cd(homedir()*"/courses/MATH347DS/homework/hw01"); |
∴ |
savefig("H01Fig01.eps"); |
∴ |
∴ |
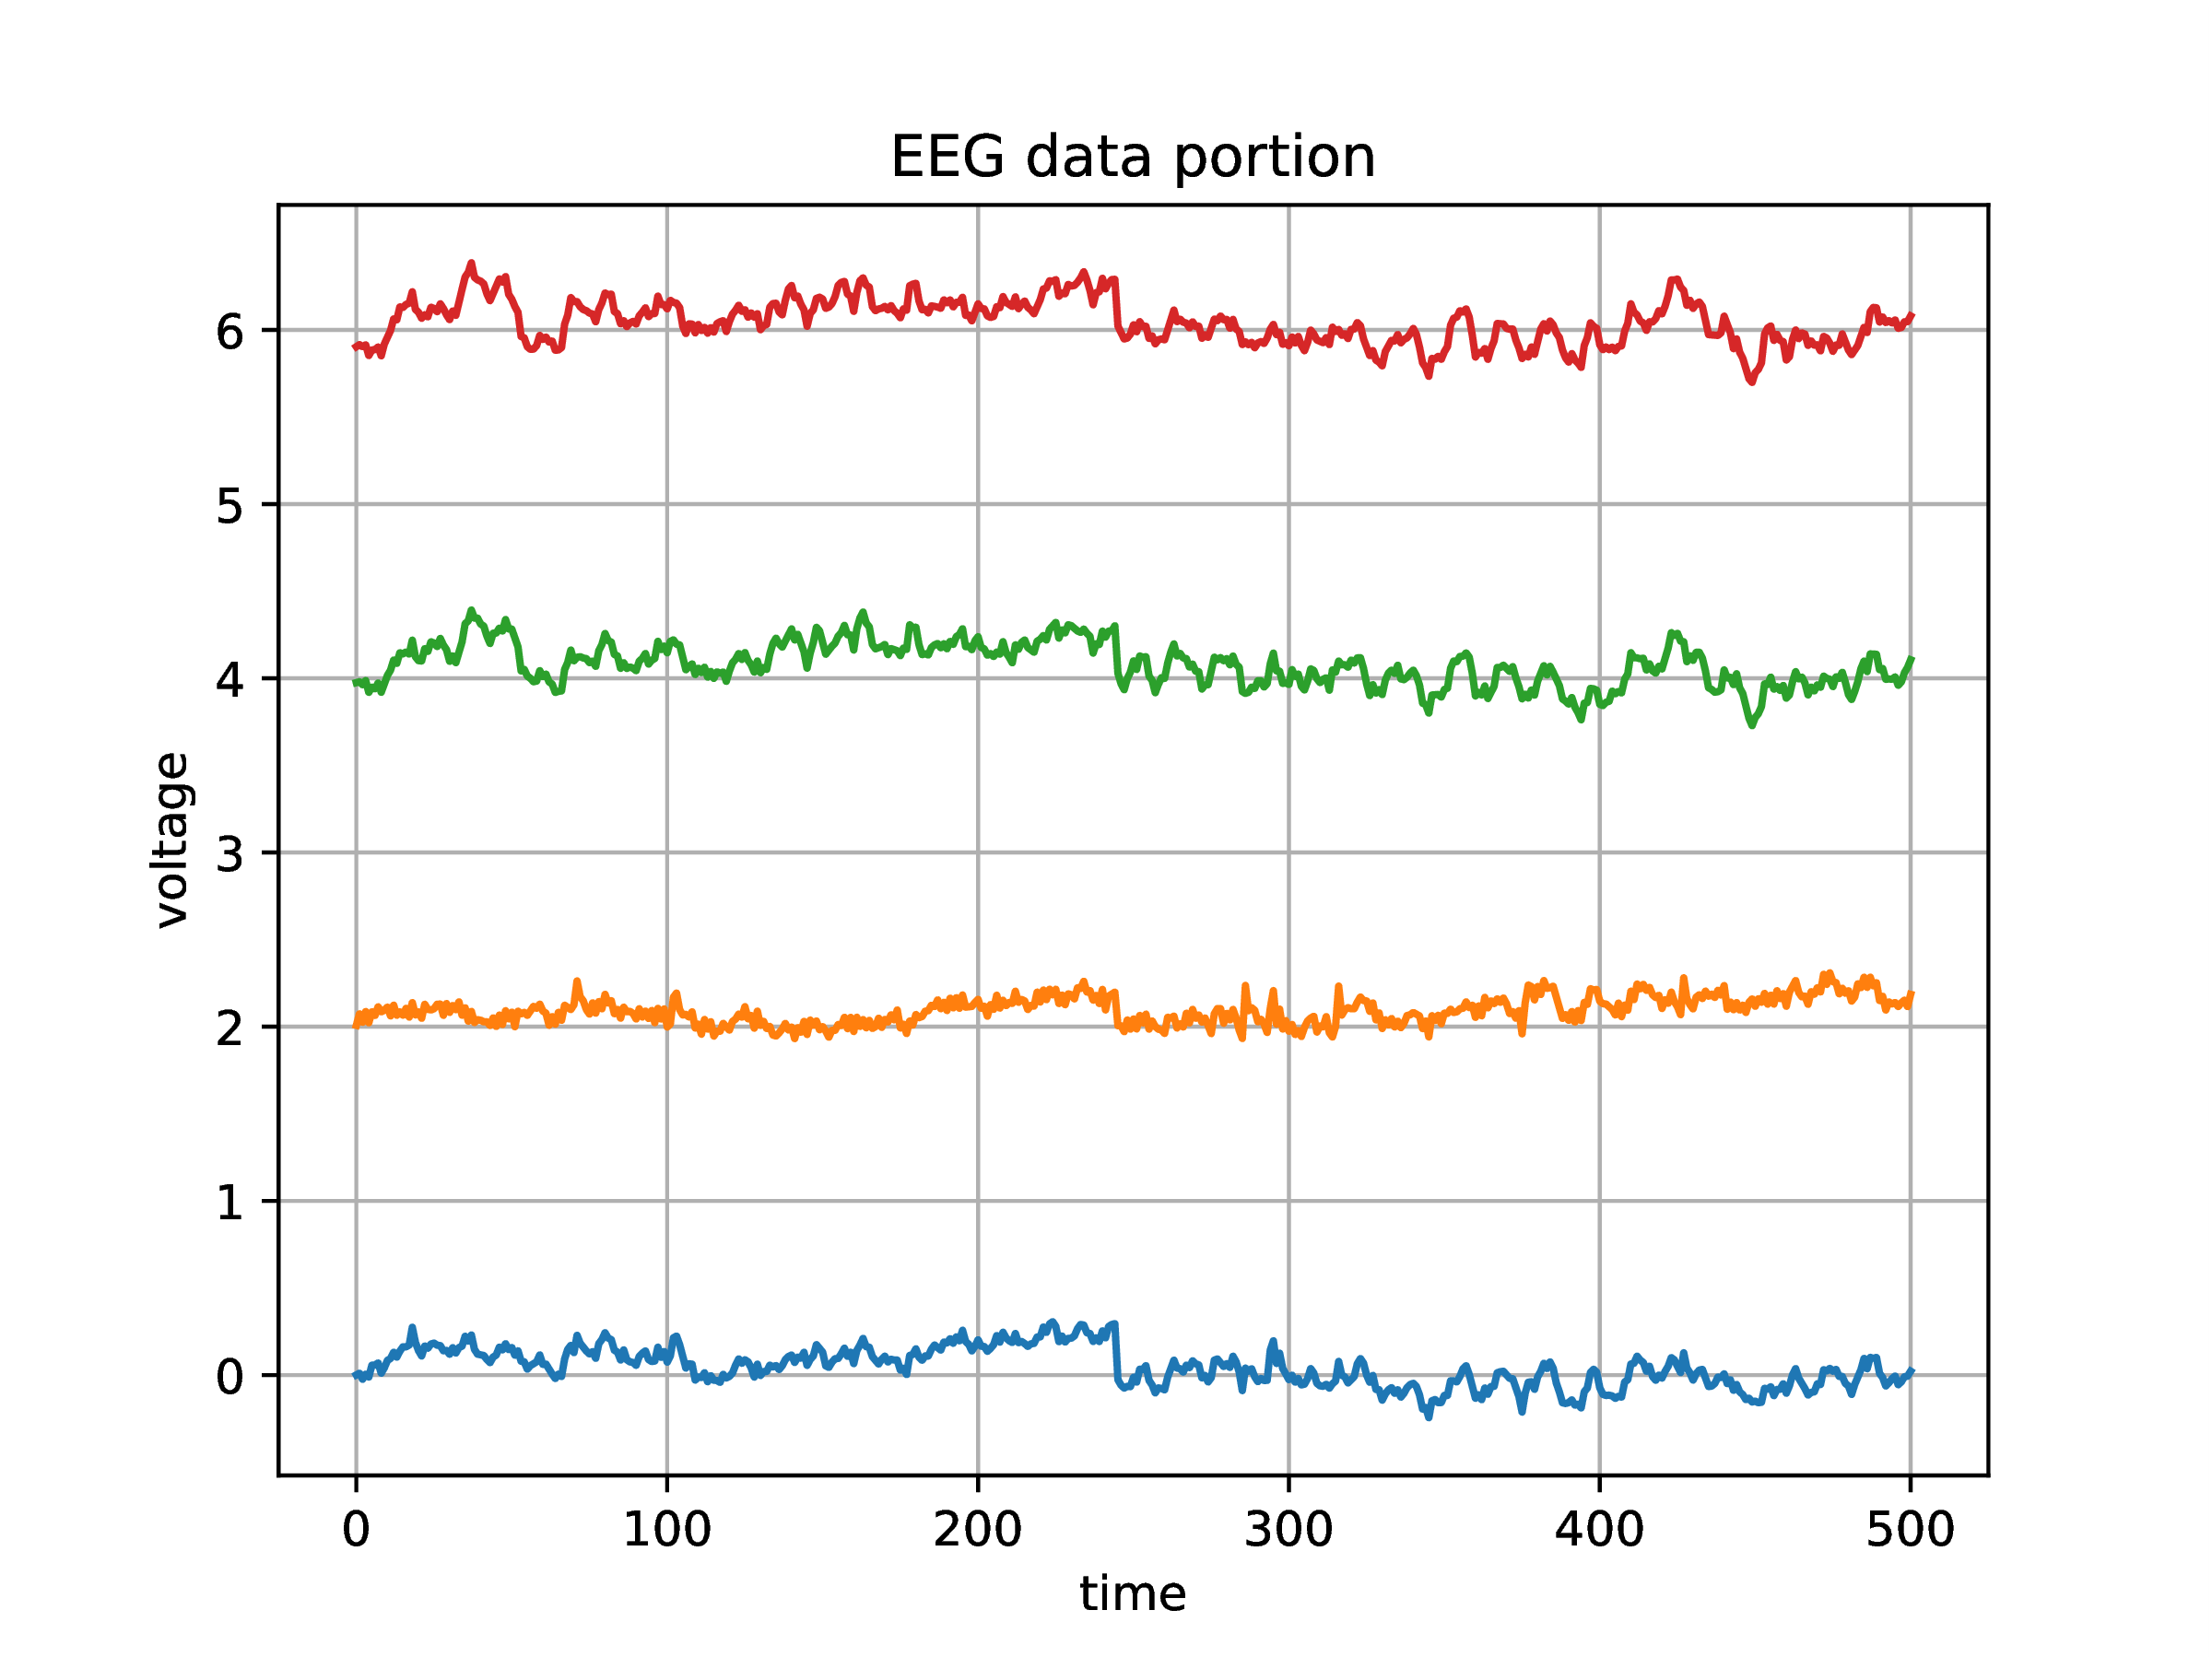
clf(); |
∴ |
for j=1:4 plot(d[1000:1500,j].+(j-1)*2) end |
∴ |
xlabel("time"); ylabel("voltage"); title("EEG data portion"); grid("on"); |
∴ |
savefig("H01Fig02.eps"); |
∴ |
Over some time subinterval, can the data from a sensor be expressed as a function of data from another sensor?
Partition sensor data into time subintervals. Over each subinterval, evaluate the -norm of centered data, for , . Plot the -norms over the entire time history.
Over some time interval, determine the angle between sensor data. Is sensor data orthogonal? Plot the angle between sensor data over the entire time history.
Can data from a sensor be expressed as a linear combination of other sensors?