|
||
| Topic: | Math@UNC environment |
| Post date: | May 22, 2025 |
| Due date: | May 23, 2025 |
This homework investigates the matrix fundamental spaces, and the concept of linear dependence and independence.
Is the zero vector a linear combination of any non-empty set of vectors?
If , with a vector space then span() equals the intersection of all subspaces of that contain .
Can a vector space have more than one basis? Give an example.
Prove that the dimension of the vector set is equal to zero.
Describe the geometry of , the column and left null space of the projection matrix , with , .
Describe the geometry of , the column and left null space of the projection matrix , with , .
Images are often processed using techniques from linear algebra. In this assignment a database with facial images will be used to investigate the fundamental vector subspaces associated with a matrix (linear mapping) and concepts of linear dependence. Each facial image has been centered, downsampled to pixels, , scaled to account for different face size, and background illumination has been equalized to enable comparison. A single image is represented as a vector of size .
The question that arises is whether a facial image with components can be represented more economically as the scaling coefficients in a linear combinations of only vectors. An average of all images has been computed and is stored in vector . Subsequently, a matrix has been constructed with orthonormal columns from which a face image can be obtained as
| (1) |
with a vector of scaling coefficients. The columns of represent deviations of facial features with respect to the average face . Since there are only column vectors in it is not expected to exactly capture any particular face . There will be some error that can be computed through a norm
The question investigated here is the efficiency and accuracy of face representation through (1).
∴ |
using MAT |
∴ |
DataFileName = homedir()*"/courses/MATH347DS/data/faces/faces.mat"; |
∴ |
DataFile = matopen(DataFileName,"r"); |
∴ |
A=read(DataFile,"A"); a=read(DataFile,"a"); |
∴ |
m, n = size(A); px=Int(sqrt(m)); py=Int(m/px); [m n px py] |
(2)
∴ |
After loading the database, a directory is created for this assignment and set as the current directory
∴ |
mkpath(homedir()*"/courses/MATH347DS/homework/hw02"); |
∴ |
cd(homedir()*"/courses/MATH347DS/homework/hw02"); |
∴ |
Define functions to display a facial image given as a vector, save an image to a file, and load a face from the collection of facial images.
∴ |
function shwface(a,px,py) im=reshape(a,px,py)' clf(); imshow(im,cmap="gray") end; |
∴ |
shwface(a,px,py); |
∴ |
function savface(a,px,py,fname) im=reshape(a,px,py)' imshow(im,cmap="gray") savefig(fname*".png") end; |
∴ |
savface(a,px,py,"averageface"); |
∴ |
∴ |
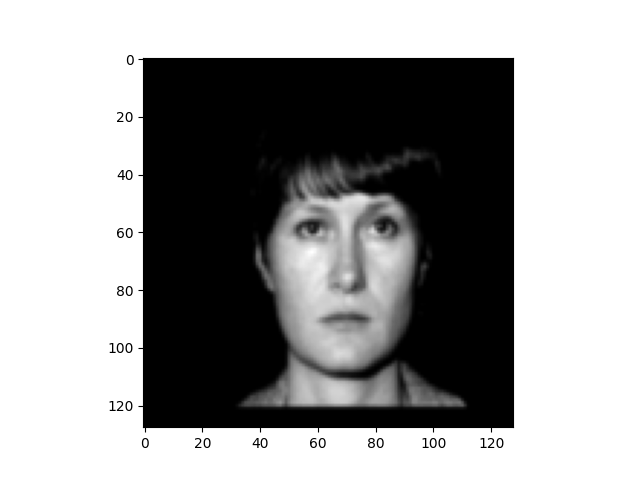
fFile=open(homedir()*"/courses/MATH347DS/data/faces/testfaces/3002"); |
∴ |
f=read(fFile); |
∴ |
size(f) |
(3)
∴ |
shwface(f,px,py); |
∴ |
savface(f,px,py,"3002"); |
∴ |
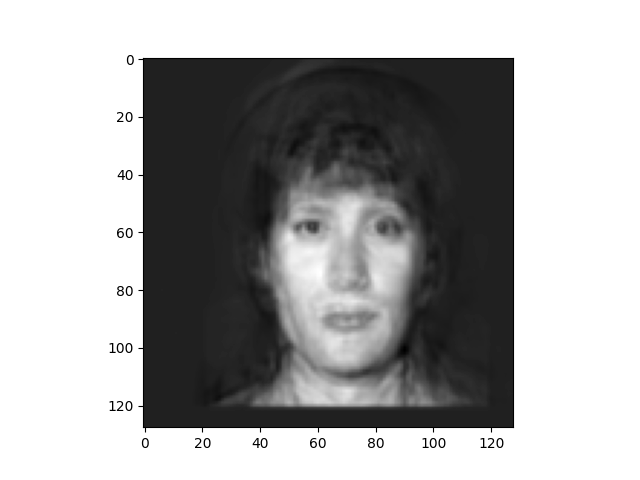
cf=f-a; |
∴ |
xf=A\cf; |
∴ |
figure(2); shwface(A*xf+a,px,py); |
∴ |
savface(A*xf+a,px,py,"x3002"); |
∴ |
norm(A'*A-I) |
∴ |
The calculations within the questions require no more that 5 matrix operations, sometimes only 1 or 2. Carefully think about the appropriate matrix operations. Specify those operations as mathematical equations before writing and executing the appropriate Julia code. Example:
The norm of is computed as .
∴ |
nrma = sqrt(a'*a) |
(4)
∴ |
The above approach is one of the principal benefits of the TeXmacs/Julia notebook format: the mathematical formulas are presented and considered first, with implementation done afterwards. Additional Julia instructions are required for visualization or for data input and output.
Verify that you are working with a well-chosen data set. Is orthonormal?
Consider some subset of the available test faces. For each face , the FTLA states that
Compute / for the chosen faces through concise matrix operations. Discuss the significance of these ratios.
For the subset chosen above, find the angles between and . Discuss their significance.
Assess the quality of the data set, by determining the maximum error encountered in representing deviations of face with respect to the mean face as a linear combination of columns of . Do so for all faces within your chosen data set.
Assess the quality of the specified mean face by constructing a different mean face for your chosen subset. Determine how close is to .
Determine the face from your chosen subset best represented by , and display the original and reconstructed faces. Do the same for the face from your chosen subset worst represented by