|
|
Posted: 09/09/21
Due: 09/15/21, 11:55PM
This assigment addresses one of the fundamental topics within scientific computation: finding economical descriptions of complex objects. Some object is described by (with typically large), and a reduced description is sought by linear combination , with (, often ). The surprisingly simple Euclidean geometry of Fig. 1 (which should be committed to memory) will be shown to have wide-ranging applicability to many different types of problems. The error (or residual) in approximating by is defined as
and 2-norm minimization defines the least-squares problem
Consider data obtained by sampling a function , with . An approximation is sought by linear combination
Introduce the vector-valued function (organized as a row vector)
such that
With a sampling of the function domain, a matrix is defined by
Tasks. In each exercise below, construct the least-squares approximant for the stated range of , sample points , and choice of . Plot in a single figure all components of . Plot the approximants, as well as in a single figure. Construct a convergence plot of the approximations by representation of point data . For the largest value of within , construct a figure superimposing increasing number of sampling points, . Comment on what you observe in each individual exercise. Also compare results from the different exercises.
Start with the classical example due to Runge (1901)
Solution. With denoting the sampling point vector, and , the function values at the sample points, the least squares problem is
where
The solution to the least squares problem
furnishes the approximation
that can be sampled at points to assess approximation error.
When carrying convergence studies such as these, it is convenient to define functions for common tasks:
sample. Returns a sample of at equidistant points
plotLSQ. Constructs a figure with plots of:
The sample points (i.e., data) represented as black dots;
The function sampled at more points, i.e., ;
The approximation sampled at points
This problem solution is obtained by:
defining the function
∴ |
Runge(t)=1/(1+25*t^2); |
∴ |
defining the basis
∴ |
function MonomialBasis(t,n)
  m=size(t)[1]; A=ones(m,1);
  for j=1:n-1
    A = [A t.^j]
  end
  return A
end; |
∴ |
Invoking plotLSQ with appropriate parameters
∴ |
clf(); plotLSQ(-1,1,Runge,MonomialBasis,16,4,64); |
∴ |
FigPrefix=homedir()*"/courses/MATH661/images/H03"; |
∴ |
savefig(FigPrefix*"Fig01.eps") |
∴ |
Once the above are defined cycling through the parameter ranges is straightforward (open figure folds to see code).
Instead of the equidistant point samples of the Runge example above use the Chebyshev nodes
keeping other parameters as in Problem 1.
Instead of the monomial family of the Runge example, use the Fourier basis
keeping other parameters as in Problem 1. In this case .
Instead of the monomial family of the Runge example, use the piecewise linear -spline basis
keeping other parameters as in Problem 1.
If has orthonormal columns, prove that is an orthogonal projector onto . Determine the expression of , the projector onto , with . Compare the number of arithmetic operations required to compute , by comparison to first determining the factorization, , and then computing .
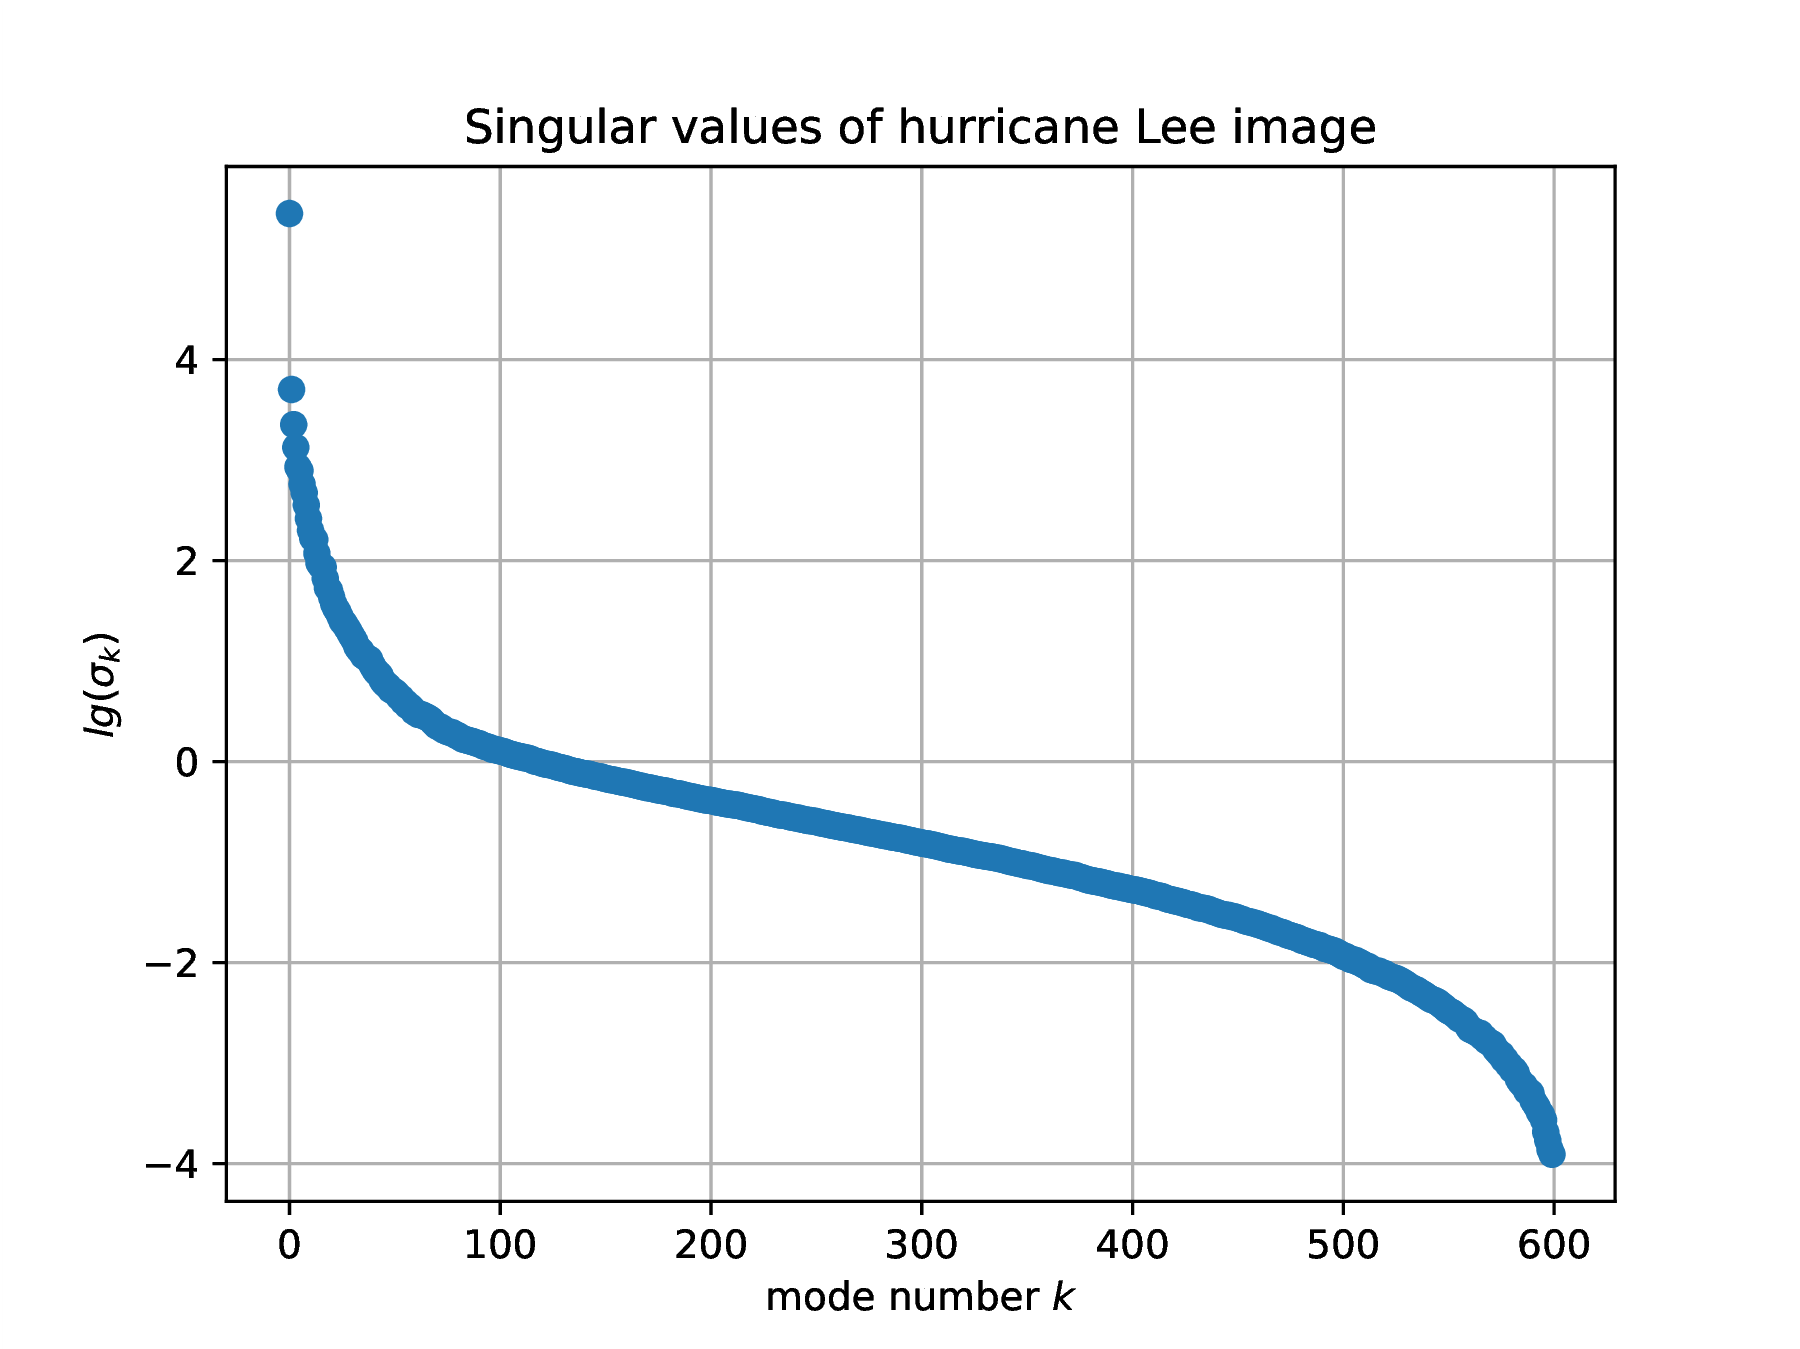
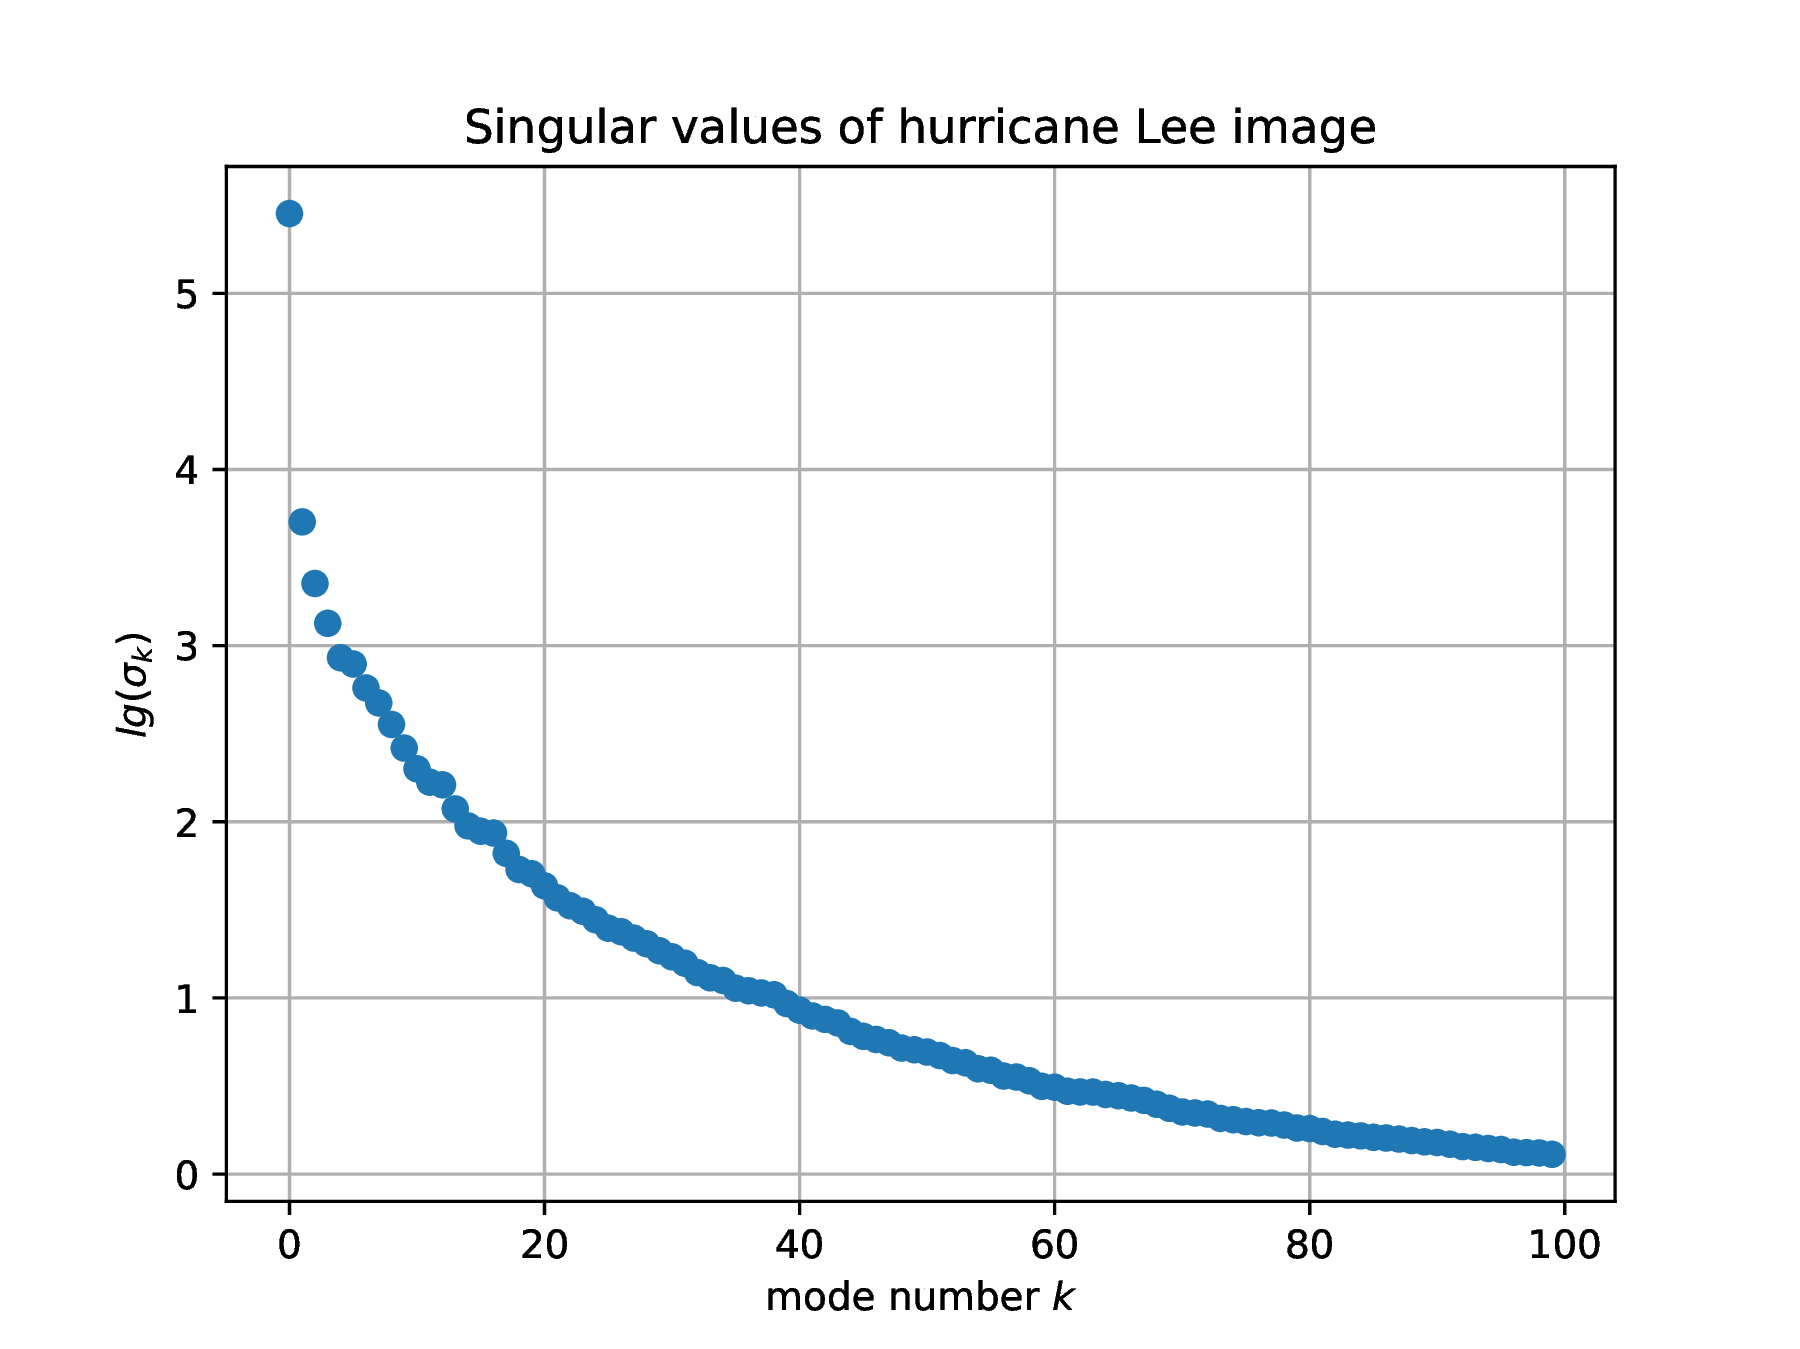
Continuing Problem 1, determine , and express in terms of the singular value decomposition of . Comment the result, considering, say, length of shadows at various times of day.
A matrix is said to be banded with bandwidth if for . Implement the modified Gram-Schmidt algorithm for a banded matrix with bandwidth using as few arithmetic operations as possible.
Solve Problem 1, Track 1.
Solve Problem 4, Track 1.
In Problem 1, Track 1, replace the monomial basis with the Legendre polynomials, whose samples are determined by decomposition . The resulting least squares problem is now