A general purpose vector graphics language
Asymptote]
size(5cm);
for (int n = 3; n <= 7; ++n) {
draw(shift(2.2*n, 0) *
polygon(n));}
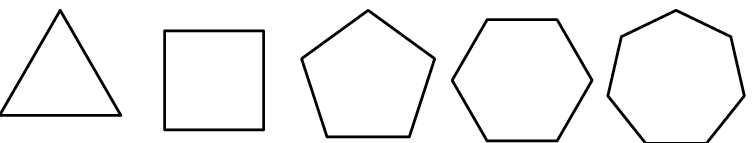
Asymptote]
 |
An environment for generation of geometrical figures
Eukleides]
box -1, -1, 7, 3
A B C isosceles
H = projection(C, line(A, B))
draw
(A.B.C)
C.H dashed
H
end
label
A 180:
B 0:
C 90:
B, H, C right
B, A, C double
C, B, A double
A.H
B.H
A.C double
C.B double
end
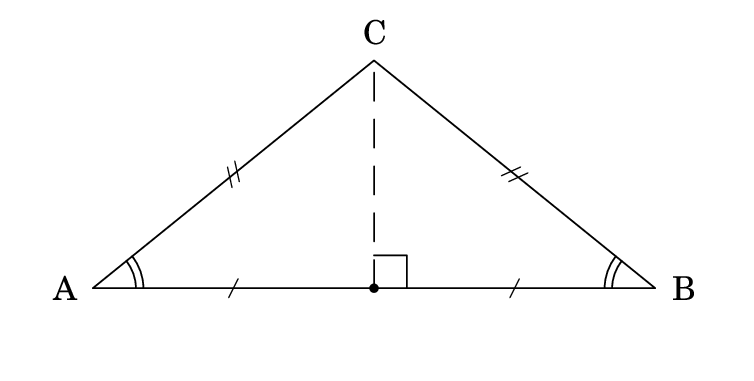
Eukleides]
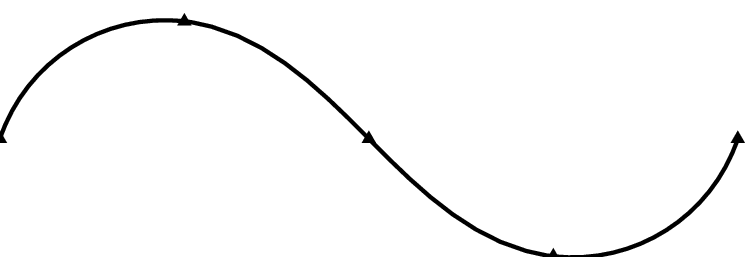
GNUplot]
plot sin(cos(x))+cos(sin(x))
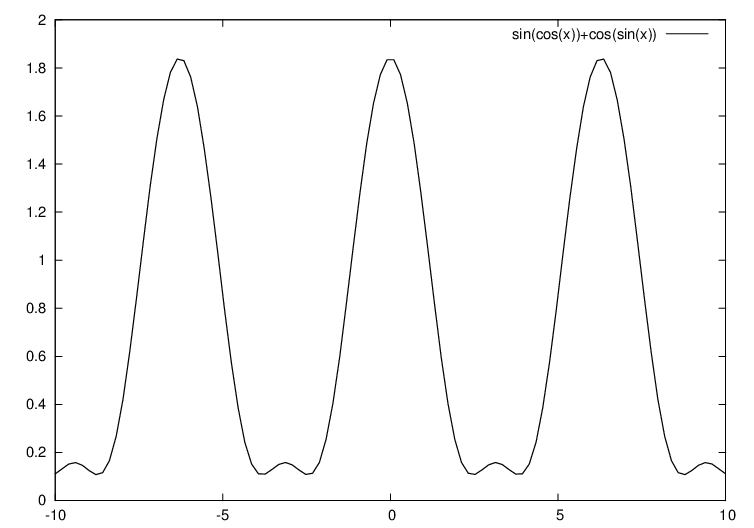
GNUplot]
;; Loading file /opt/TeXmacs/plugins/lisp/clisp/clisp-init.lisp …
;;  Loading file lisp/tmlib.lisp …
;;  Loaded file lisp/tmlib.lisp
CLisp>
(car '(a b c))
CLisp>
(cdr '(a b c))
CLisp>
In[1]:=
N[Pi,1000]
In[2]:=
100!
In[4]:=
D[Sin[Cos[x]]+Cos[Sin[x]],{x,10}]
In[5]:=
1 == 2
In[6]:=
1 == 1
In[7]:=
Eq = x==1
In[8]:=
Eq /. x->1
In[9]:=
ODE = y'[x] + x y[x] == Sin[x]
In[14]:=
sol = DSolve[ODE,y[x],x]
In[17]:=
z[x_] = y[x] /. sol[[1,1]]
In[15]:=
sol[[1,1]]
In[18]:=
z[1.]
In[19]:=
(%i1)
diff(sin(x),x);
(%i2)
octave>
A=rand(3)
octave>
inv(A)
octave>
from pylab import *
Python]
x=arange(0.,3.15,0.01); y=sin(x); plot(x,y);
Python]
show()
Python]
Python]
pwd
Shell]
ls
Shell]
courses Downloads fontconfig perl5 TeXmacs
Shell]